
I ran out of space on my fertility chart! I reached day 35 and found that I had nowhere else to go – a normal cycle is 22(ish)-35 days and I have now passed that mark.
Through September I have had the weirdest chart. Temperature is supposed to be relatively steady but kinda low in your early cycle then, after the LH surge that marks ovulation, your temperature should rise a bit and stay a little higher until your period. Well my chart looks like a (very messy) roller coaster!
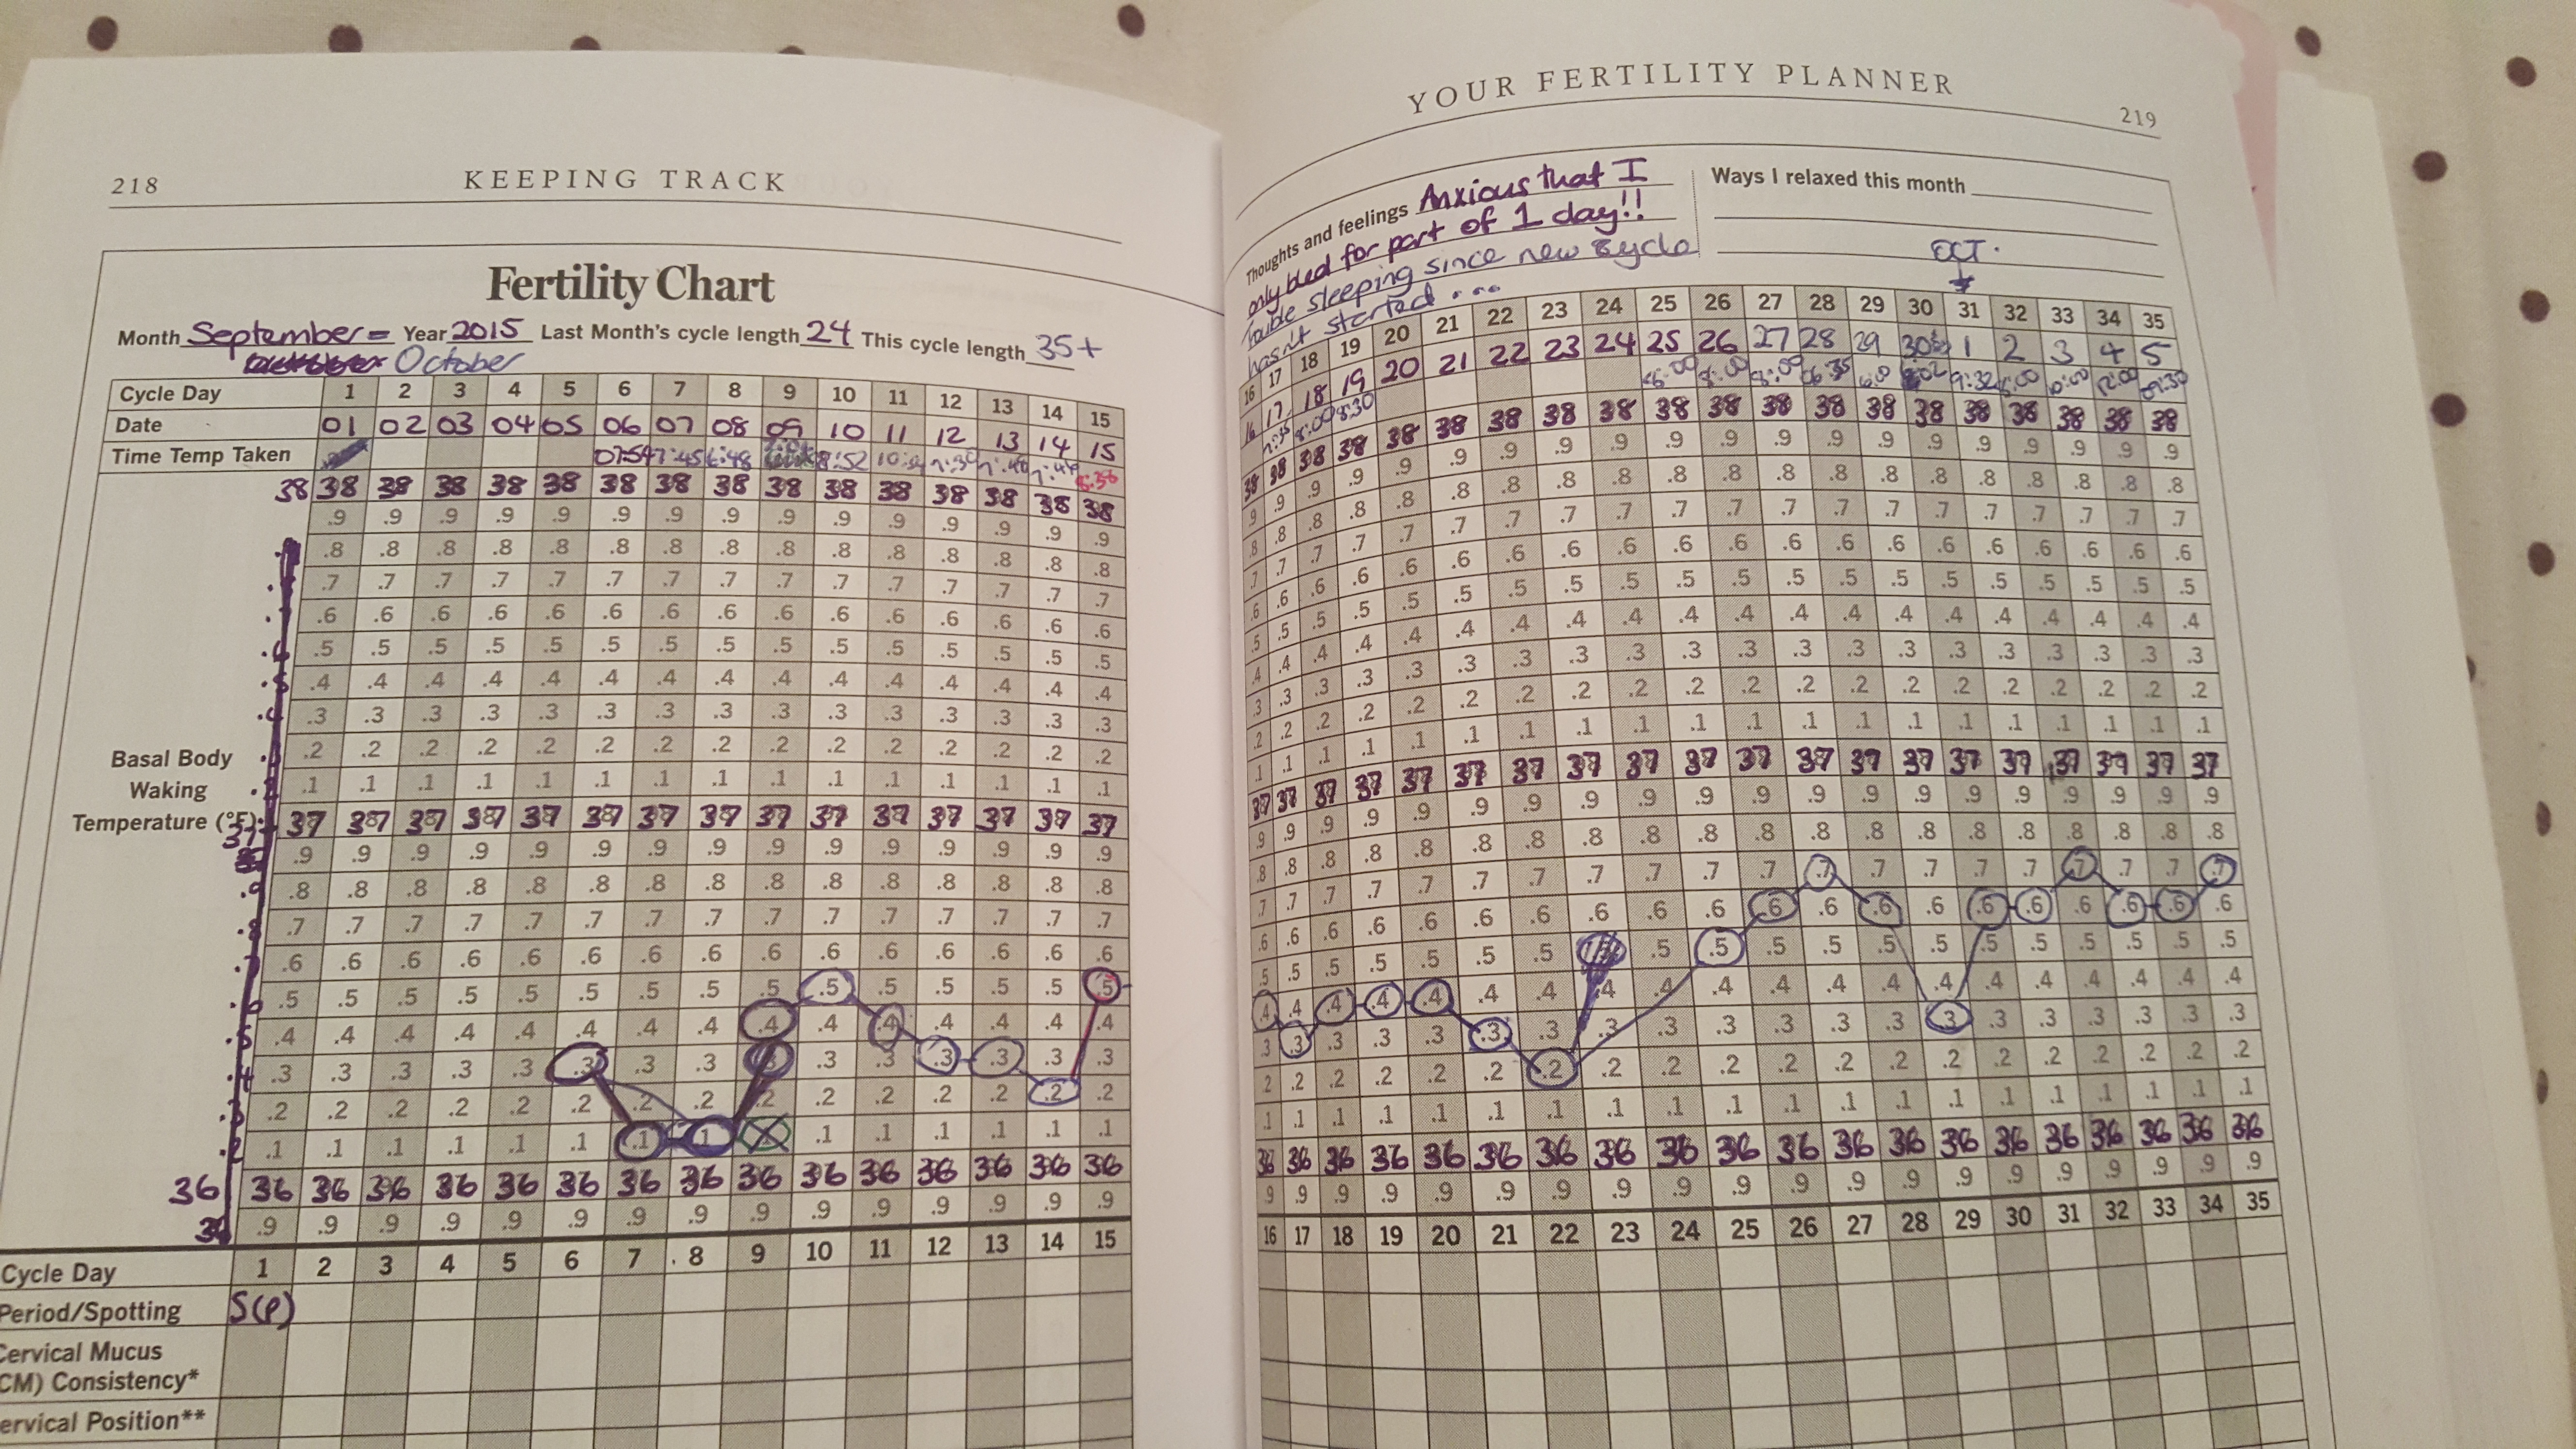
I started off incredibly cold and then I got a bit warmer (which coincided with us finally turning on the heating at home and me wearing thicker PJs, go figure!), and it’s been up and down ever since. I missed a few days tracking here and there but even so there’s no clear pattern and we know I didn’t ovulate.
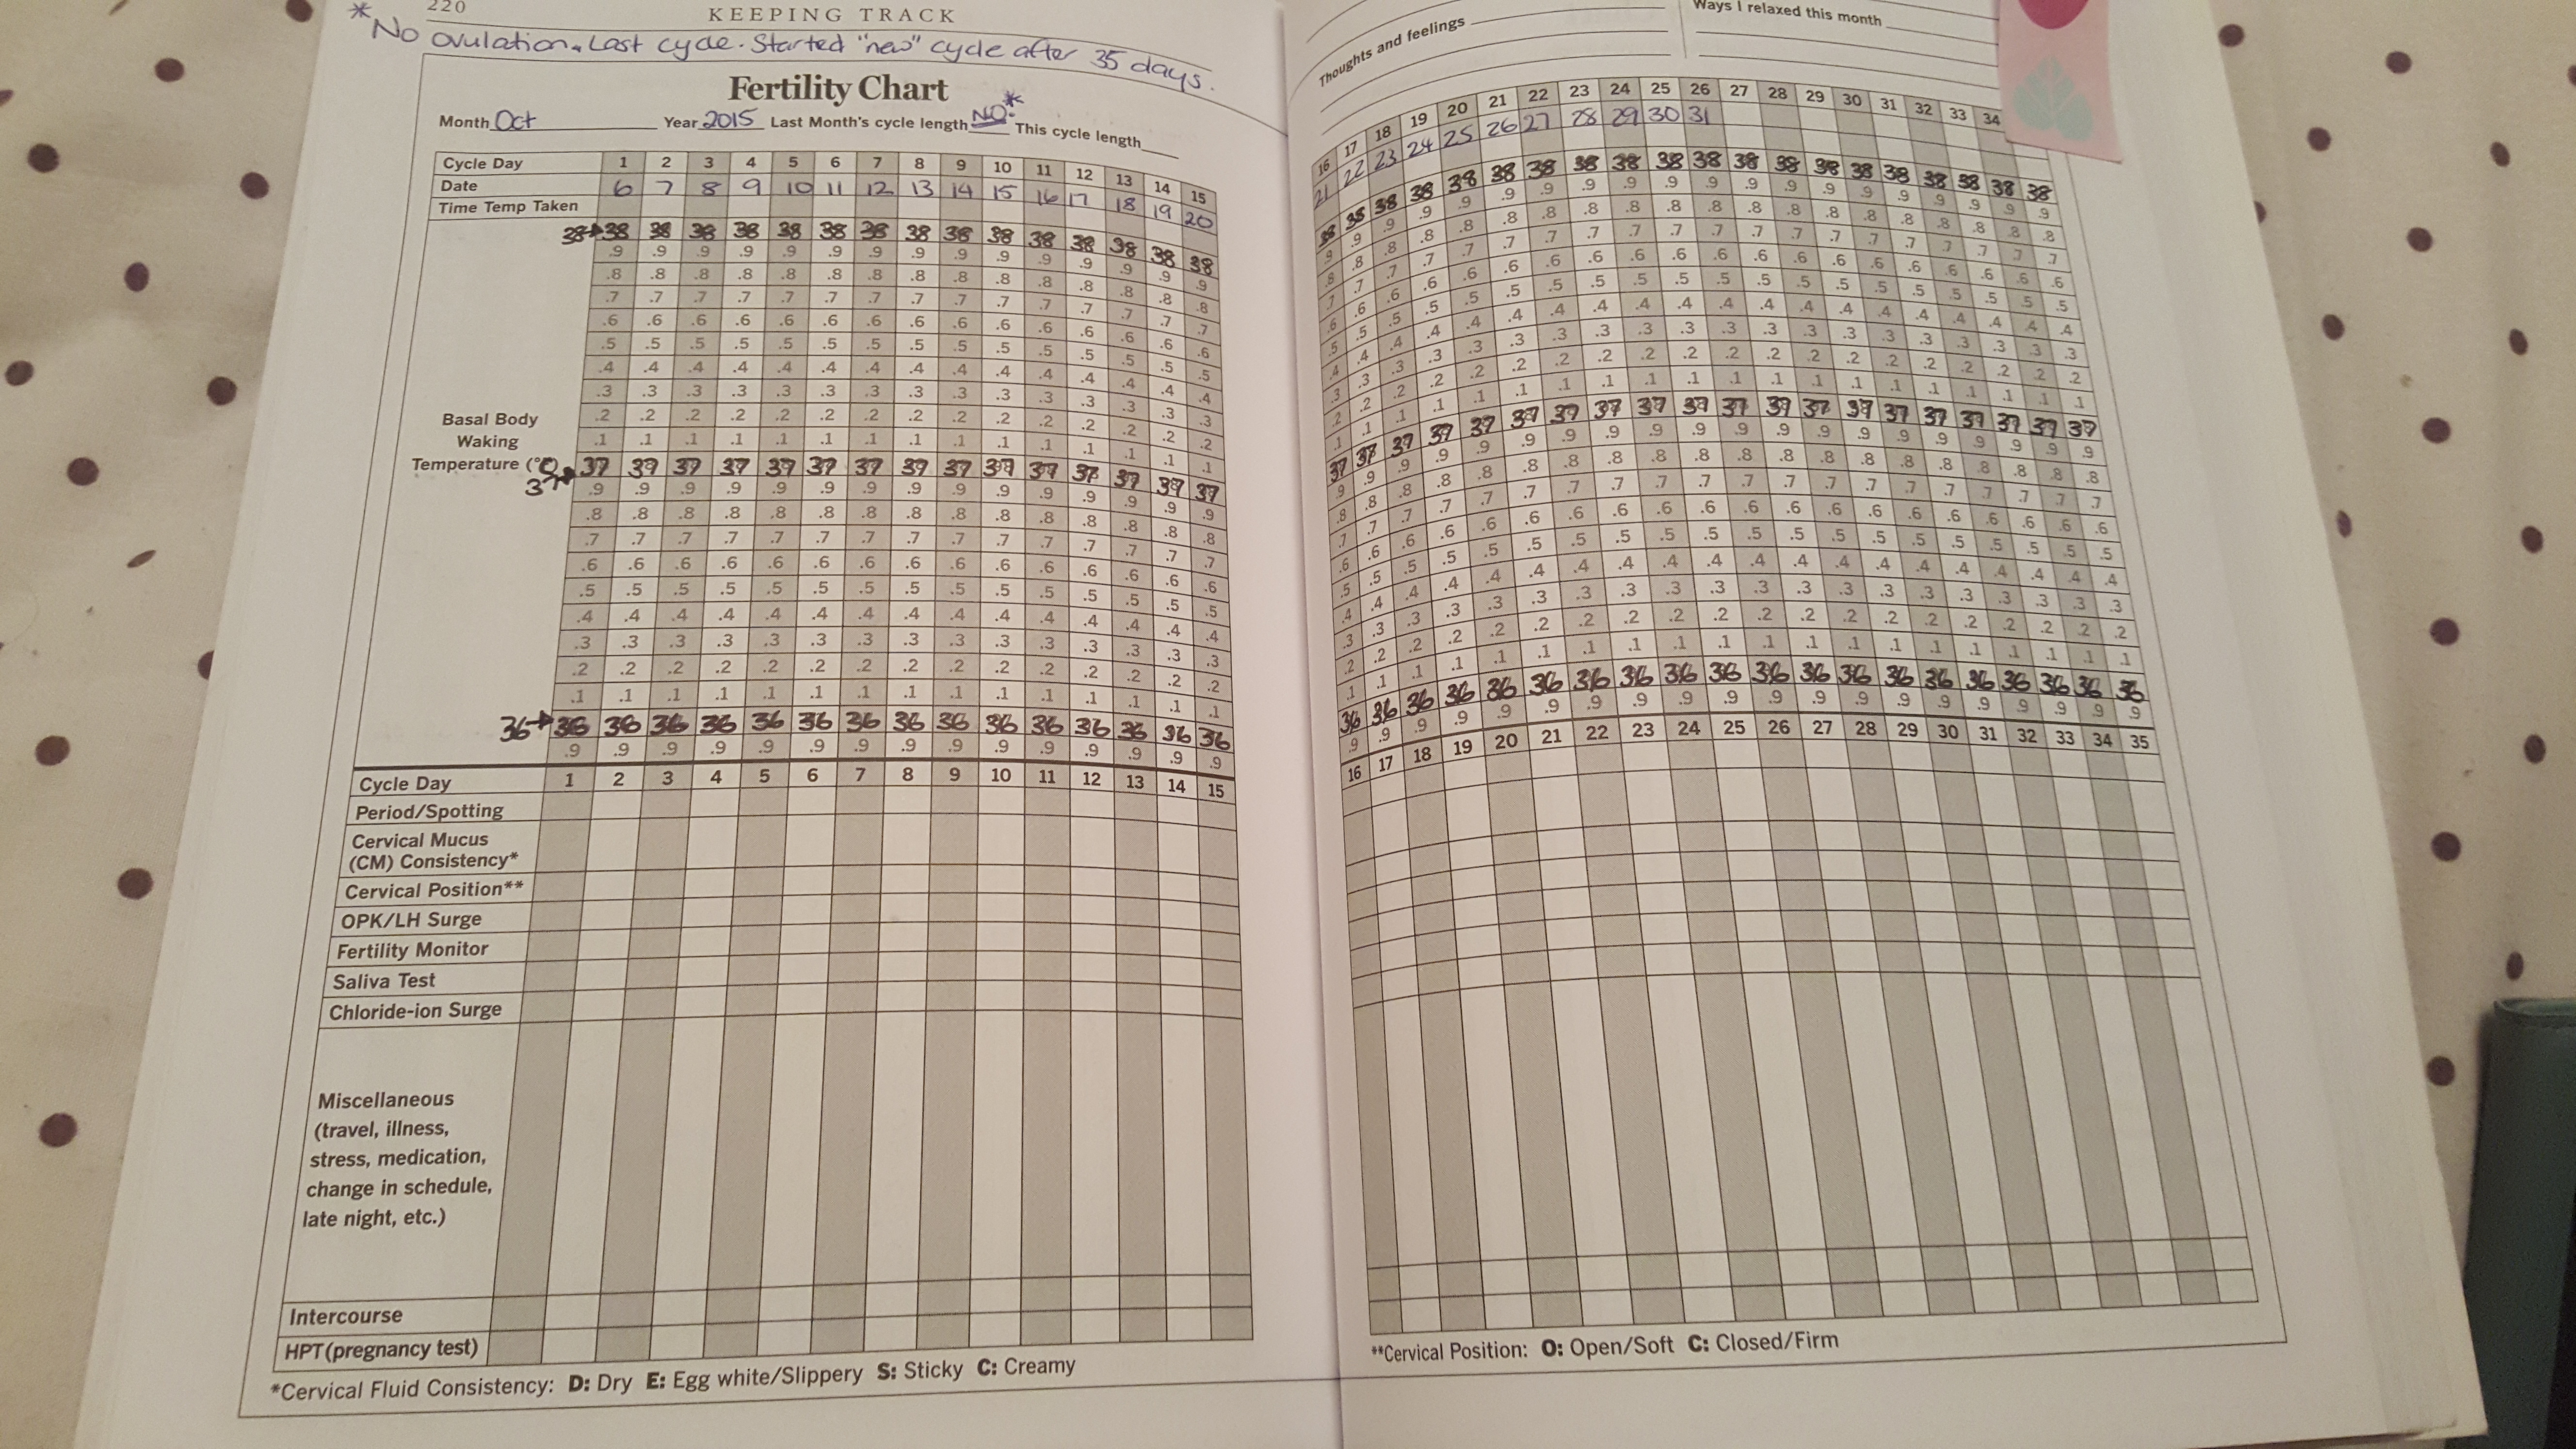
So anyhoo… I got to day 35 and that was the end of the chart; so I’ve had to turn over a new leaf and start afresh. I’m not sure if I should count the start of this chart as a new CD1 or just keep counting on from 36. Either way I have a nice new chart to be getting on with – I’ve made a few of my own style changes (changes the Fahrenheit temperature scale to Celsius); and put in some random info to link this chart back to the last one. Let’s see if any ovulation shows up, or if I’m in for another roller coaster ride.
Does anyone else just love it when you have a nice fresh page to start filling in?
